How to Structure Your Meta Ads Metrics Like a Funnel
Feb 12, 2025
0 Comments
Published by webmaster
If you’ve been navigating the constantly evolving world of online advertising, you understand how overwhelming it can be. Today, we’re exploring a transformative strategy: structuring your Meta Ads metrics like a funnel. This approach can greatly improve customer engagement, boost conversions, and drive your business forward. So, take a moment to settle in, and let’s embark on this journey together!
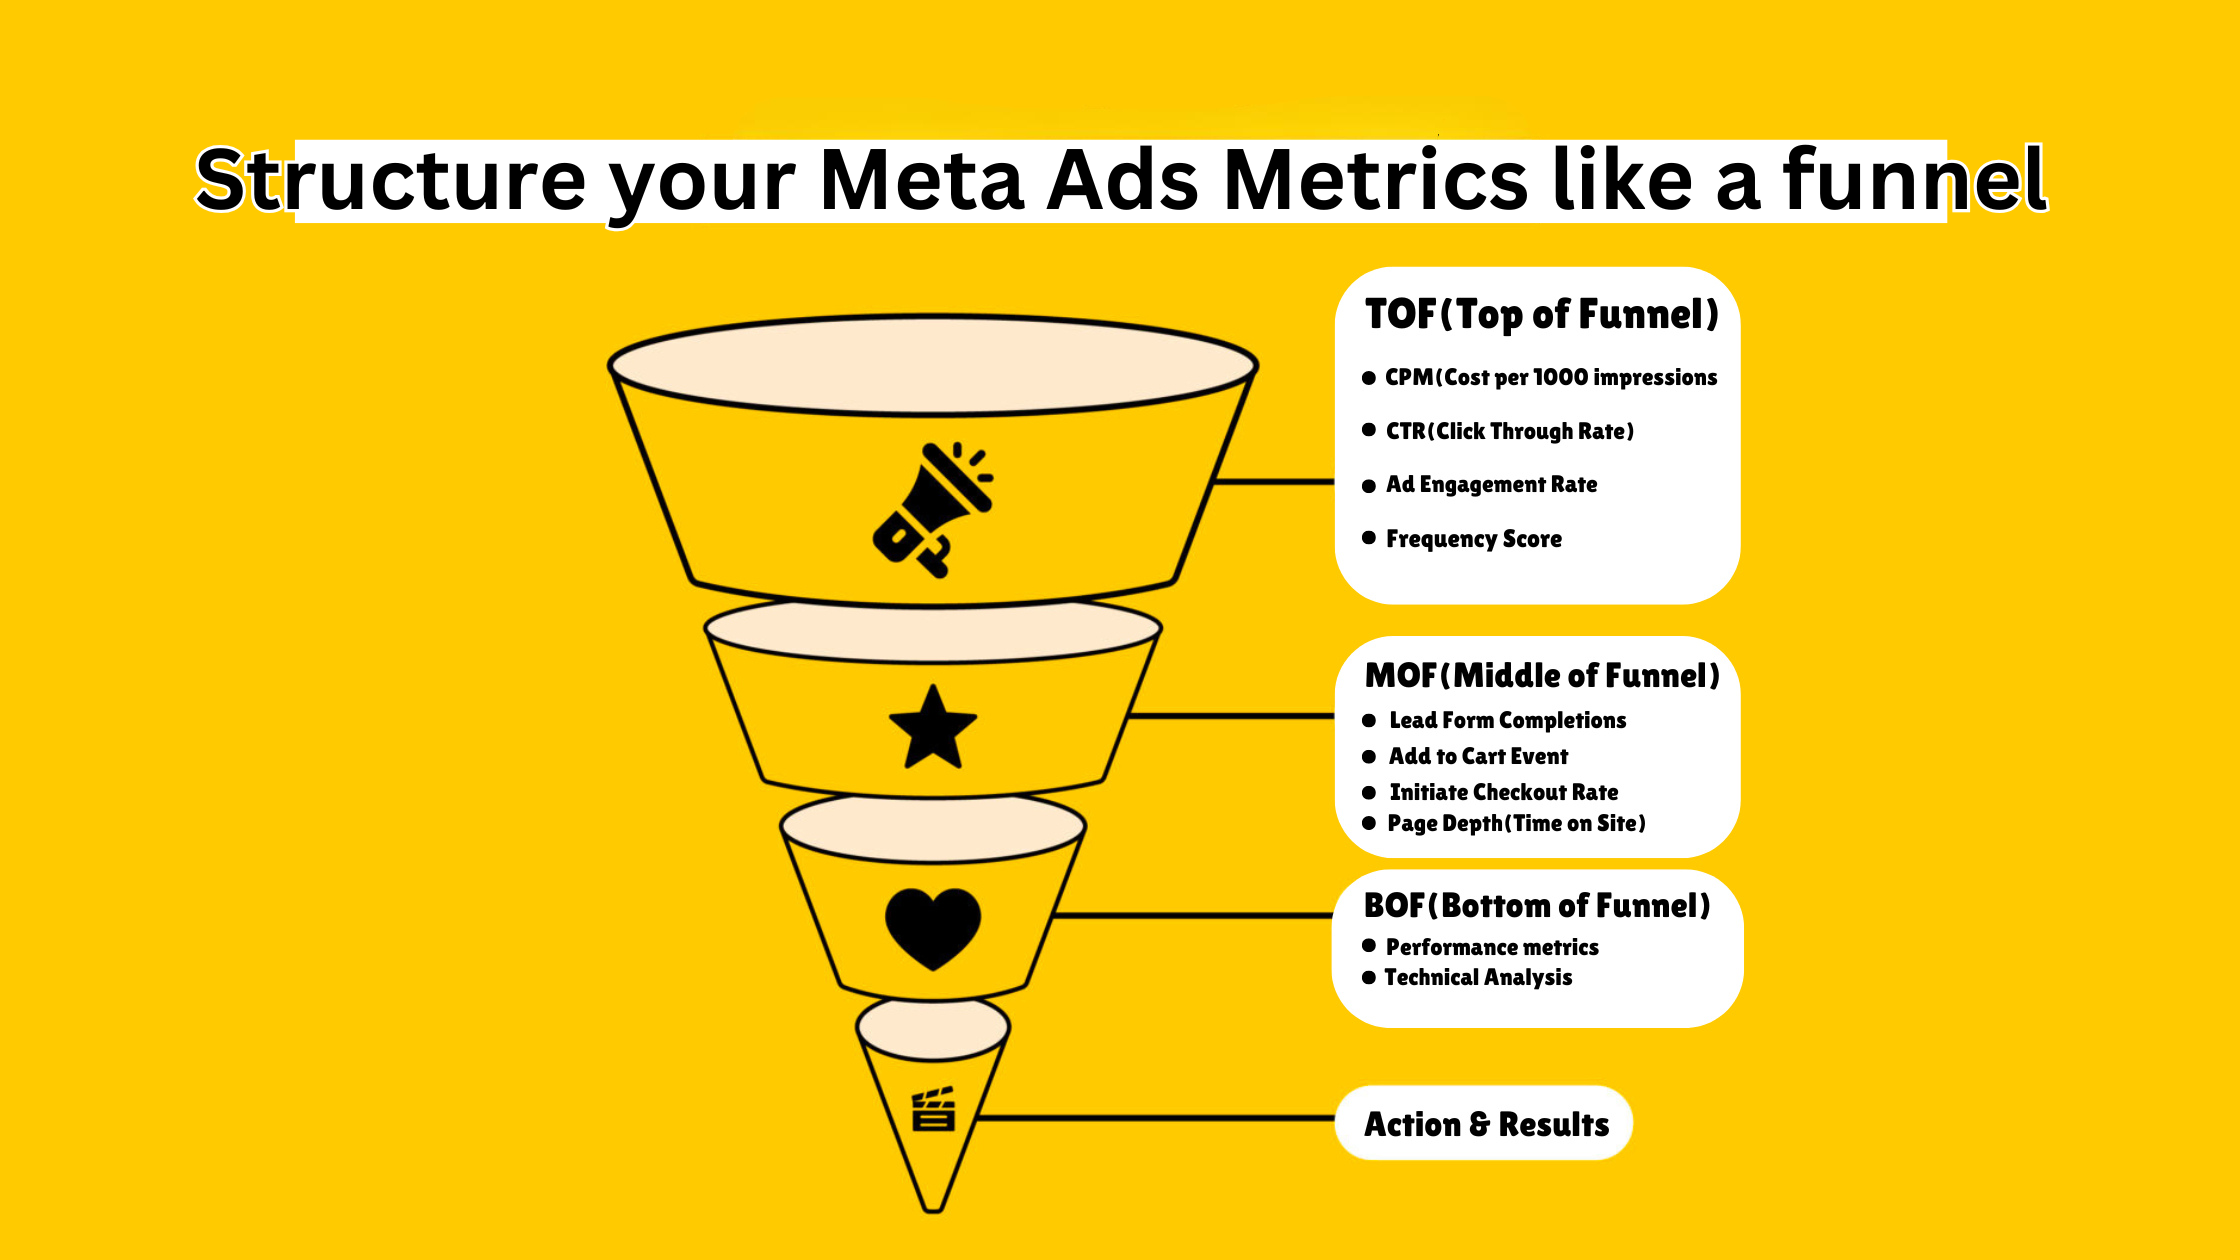
The Journey Begins at the Top of the Funnel (TOF)
Picture this: you’re standing in a crowded subway station during rush hour—people buzzing past you, each wrapped up in their own world. Your job is to stand out and grab the attention of potential customers before they slip through the cracks. This phase is known as the Top of Funnel (TOF).
Getting Attention
At this stage, your primary objective is to create awareness and draw people in. Here’s how you can effectively track and optimize your efforts:
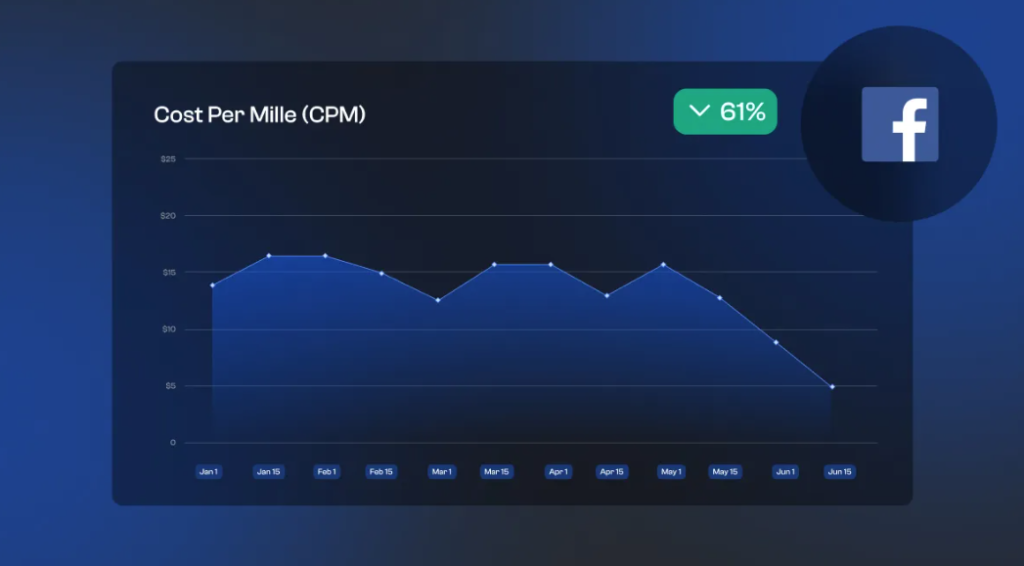
1. CPM (Cost Per Thousand Impressions)
Let’s break it down. CPM indicates how much you’re spending to get your ad in front of 1,000 viewers. A lower CPM means you’re reaching many people without breaking the bank. This is fantastic for brand visibility!
● Balancing Reach and Frequency: Finding the right balance is crucial. Facebook suggests an optimal frequency score of 1.5 to 3.0 for most ads, as high frequency can cause ad fatigue, while low frequency may hinder recognition.
● Geotargeting: CPM varies by geography, with higher competition and costs in metropolitan areas. AdEspresso recommends optimizing ads based on the location of your highest-performing audience.
2. CTR (Click-Through Rate)
The Click-Through Rate calculates the percentage of people who clicked on your ad after seeing it. A robust CTR is like a popularity meter for your content!
● Tracking Audience Engagement: A benchmark CTR for Facebook ads is 0.5% to 1.6%; exceeding this range indicates strong performance. Use Facebook Insights to segment CTR by demographics for tailored campaigns.
● Crafting Irresistible CTAs: WordStream suggests experimenting with various calls to action. Urgent or exclusive phrases like “Limited Time Offer” or “Join Now – Spots Filling Fast!” can significantly increase clicks.
3. Ad Engagement Rate
Now, let’s talk about engagement. When folks like, share, and comment on your content, it’s a sign you’ve struck a chord. This isn’t just about vanity metrics; it reflects how well your audience connects with your brand.
● Content Strategy: Use storytelling, user-generated content, and interactivity (e.g., polls). BuzzSumo finds visuals like videos and infographics drive higher engagement.
● Building Community: Regularly responding to comments can boost engagement by up to 30% and strengthen community ties.
4. Frequency Score
Frequency measures how often your ad is shown to the same person.
● Ad Fatigue: High ad frequency can decrease effectiveness. AdRoll warns that frequency over 5 to 7 may annoy audiences and reduce returns. Regularly monitor performance as you adjust frequency.
● Segmenting Audience: Use audience segmentation to customize ads for frequent viewers, tailoring content based on previous interactions or their stage in the customer journey to minimize redundancy.
The Middle of the Funnel (MOF) – Raising Intent
Creative photo representing customer intent and engagement
Alright, your ads have captured attention, and now it’s time to turn that fleeting interest into genuine intent. Welcome to the Middle of Funnel (MOF), where nurturing leads is crucial.
Getting Serious
In this stage, you want to deepen the relationship with your audience. Here are crucial metrics to zero in on:
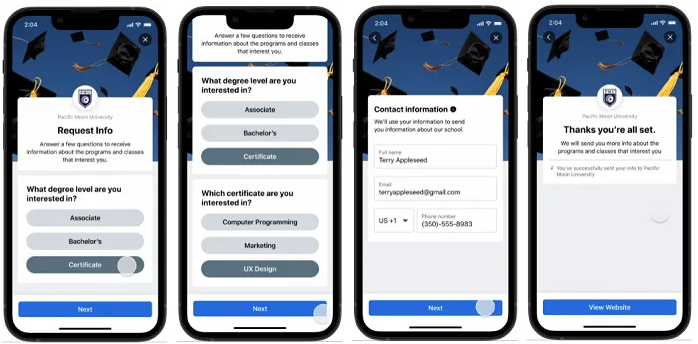
1. Lead Form Completions
Lead forms allow you to gather valuable information from interested parties.
● Utilizing Facebook Lead Ads: Facebook allows integrated lead forms in ads, improving completion rates by over 20% with autofill options.
● Incentivizing Completion: Offer discounts or downloadable content as incentives, as lead magnets can significantly boost conversion rates.
2. Add to Cart Events
Imagine a customer excitedly browsing through your products, adding a few items to their cart. Tracking this behavior reveals a lot about what’s capturing their interest.
● Behavioral Insights: Retargeting ads for cart abandoners can increase conversion rates by 2-3x, especially with dynamic ads showcasing items left in the cart.
● Exit Intent Popups: Use exit-intent popups to engage users about to leave your site, offering reminders or discounts to recover potential sales.
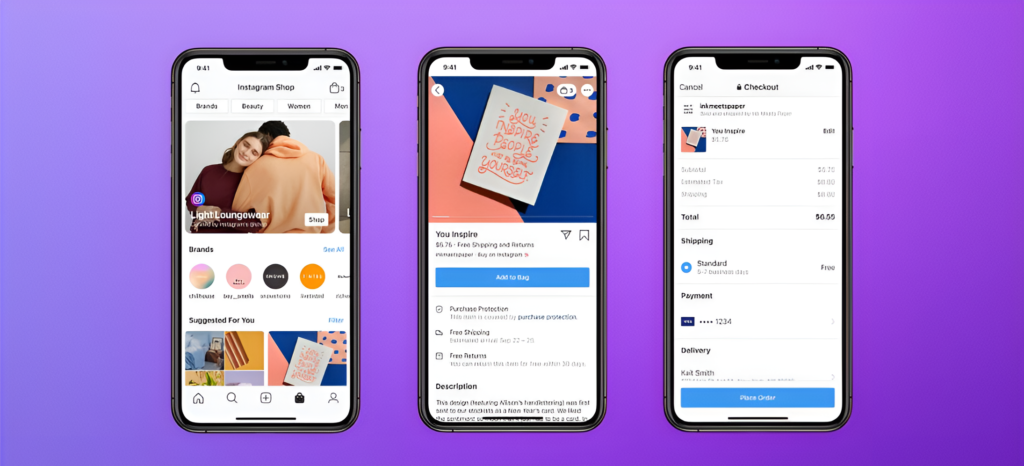
3. Initiate Checkout Rate
This metric represents the percentage of users who start the checkout process—a pivotal moment!
● Initiate Checkout Rate: Represents the percentage of users starting the checkout process.
● Identifying Abandonment Issues:
Google Analytics tracks user drop-offs in checkout.
17% abandon carts due to complexity (Baymard Institute).
● Streamlined Checkout Experience: Simplifying the process, like using Shopify’s One-Page Checkout, boosts completion rates and reduces friction.
4. Page Depth (Time on Site)
Understanding how long users stay on your site and how many pages they explore provides insights into your content’s effectiveness.
● Utilizing Heatmaps: Tools like Hotjar offer heatmap tracking to visualize where visitors spend their time, highlighting attention-grabbing elements versus ignored ones.
● Engaging Content: Creating high-quality, in-depth articles (over 2,000 words) is key, as they tend to rank better in search and keep visitors engaged longer (Moz).
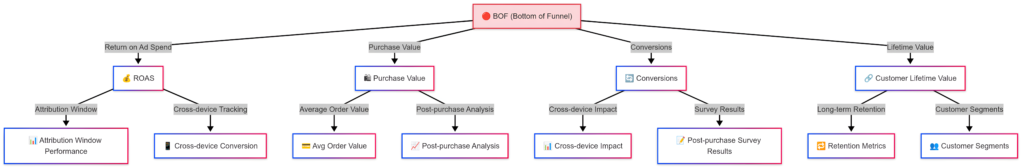
The Bottom of the Funnel (BOF) – Converting Traffic
Congratulations! You’ve successfully attracted and engaged your audience. Now it’s time for the big win at the Bottom of Funnel (BOF). This is where all your hard work pays off and conversions happen.
Making the Sale
Here are the vital metrics you must monitor:
1. ROAS (Return on Ad Spend)
ROAS measures the revenue you generate against every dollar spent on advertising.
● Matrix of Success: A ROAS target can differ according to business type. For retail, a 400-500% ROAS is often considered a benchmark, whereas SaaS companies may strive for 300-400%. Keeping these targets in mind will guide campaign adjustments for viability.
● Feedback Loop: Use analytics to create a feedback loop, allowing you to pivot strategies quickly. For instance, if a certain campaign yields lower than expected ROAS, consider pausing it and reallocating the budget to more successful ads.
2. CPA (Cost Per Acquisition)
● Customer Acquisition Cost (CPA): Indicates spending to acquire a new customer.
Holistic Approach: Segment CPA by channel; prioritize high-CLV customers in paid channels (Neil Patel).
● Optimizing Campaigns: Focus on effective ad formats and targeting to maximize conversions while managing CPA, as recommended by Facebook.
3. Purchase Value
Tracking the average order value is crucial for understanding customer behavior.
● Average Order Value (AOV): Essential for understanding customer behavior.
● Increase AOV: Use cross-sells and upsells during checkout; related offers can boost AOV by 30% (Ecommerce CEO).
● Seasonal Promotions: Leverage peak sales seasons and tailor offers to enhance AOV.
4. Customer Lifetime Value (CLV)
CLV estimates how much a customer will potentially spend over their lifetime.
● Loyalty Programs: Increase CLV with loyalty programs; a 5% retention increase can raise profits by 25-95% (Bain & Company).
5. Cross-Device Conversions
In today’s mobile-first world, users interact with ads across multiple devices.
● Understanding Multi-Device Behavior: According to Google, 85% of consumers start a task on one device and finish it on another. Tracking this behavior illuminates the need to optimize campaigns for various platforms.
● Implementing Unified Analytics Tools: Utilize tools like Google Tag Manager or Facebook Pixel that help track cross-device conversions more effectively, giving you a holistic view of user interactions.
The Hidden Key – Attribution & Post-Purchase Insights
The results are rolling in, customers are purchasing, but there’s still more to discover! The hidden gems of attribution and post-purchase insights are essential for continual improvement.
Unraveling Mysteries
1. Attribution Window Performance
This tells you how long after someone sees your ad they make a purchase.
● Attribution Models: Different models like last-click, first-click, and linear have distinct advantages. HubSpot recommends using a multi-touch attribution model to analyze the impact of multiple channels in the customer journey.
● Marketing Mix Modeling: This investment offers insights into conversion-driving channels, helping to allocate budgets more effectively.
2. Cross-Device Conversion Tracking
Here’s the detective work! Tracking conversions across devices helps you piece together the customer journey.
● Advanced Measurement Techniques: Use device matching and tools that integrate behavioral data to accurately map user journeys.
● Case Studies: Companies like Unbounce have successfully tracked cross-device conversions to refine their strategies based on user behavior.
3. Post-Purchase Survey Results
Gaining feedback from customers after a purchase can offer invaluable insights.
● Survey Implementation Tools: Use platforms like SurveyMonkey or Typeform for structured post-purchase surveys to gather qualitative insights on customer satisfaction.
● Incentives for Feedback: Increase response rates by offering discounts or giveaway entries in exchange for survey completion.
Conclusion:
In summary, structuring your Meta Ads metrics like a funnel transforms your advertising approach, enabling you to create meaningful customer experiences. By analyzing metrics at each funnel stage and leveraging insights from attribution and post-purchase analyses, you can refine your strategies for better results.
Ready to elevate your advertising efforts? Explore comprehensive PPC management services to implement this funnel framework effectively. Discover more here and unlock the full potential of your campaigns.
Happy advertising! Keep experimenting, adapting, and you’ll be on your way to significant advertising success!